Realtime Dashboardfor Complex Information
All relationships get visible
Go to Sandbox Documentation

All features are freely available for both non-commercial and commercial users. Anyone can contribute to the project.

For personal use, the sandbox works more than just for a trial. You can immediately create your graphs and share with others.

Blitzboard can be integrated with graph databases and run on cloud services for enterprise security and data management.
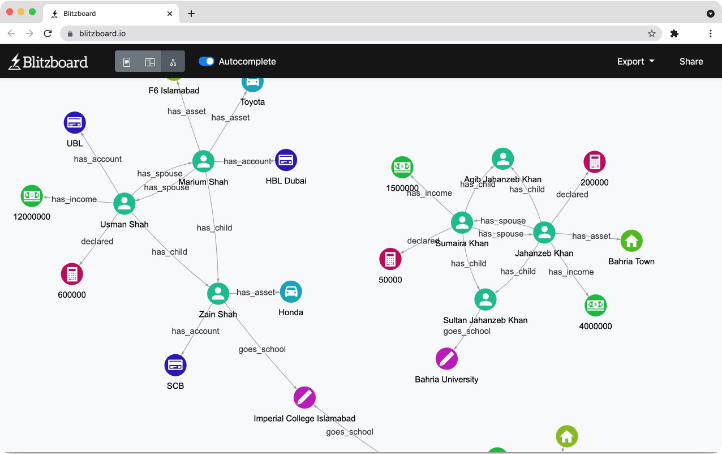
In graph visualization, the nodes can represent persons, houses, cars, schools, bank accounts, or any. They are also connected by various relationship types. Blitzboard helps customer 360 degrees analysis and fraudulent patterns with its capability to draw network graphs and customize them.